By Tom Bradley
Steadyhand has now been in business for over seven years. That’s exciting for all kinds of reasons, but today I’ll focus on just one – investment returns.
We now have 7-year numbers, and not one, not two, but three 5-year performance periods. Clients can look at fund and portfolio returns for 5-year periods ending June 30th 2012, 2013 and 2014.
Let me tell you why I’m pleased about this.
Better to be lucky than good
What happens in a month, quarter, year or even two years contributes to long-term wealth generation, but it’s not that meaningful in assessing performance. Short-term results are measuring luck, not skill. They’re highly sensitive to what happened in the last few quarters, or what we call ‘end-date sensitivity’.
The longer the history, however, the better chance a client has of assessing skill and quality of counsel.
Client experience
Longer-term returns ultimately tell the story of how a client has done. In our case, seven years covers a full market cycle approximately (we’ll only know exactly in hindsight). In other words, we’ve been through both the ups and downs.
In addition to the longest period, however, it’s useful to look at what the ride was like. One of the best ways to do this is to look at periods with different end dates. A chart of annual returns is useful in this regard. As you can see from our Volatility Meter, a picture tells a thousand words.
It’s even more useful, and relevant to the client experience, to look at longer periods at different end dates. We’ve chosen to go with 5-year periods, or what we call Rolling 5's (also referred to as ‘Moving’ 5-year periods) because they’re easily accessible and they test the outer limits of investors’ patience.
Rolling 5’s
In a table of rolling returns, each number represents a unique period, but there is an overlap with the years that make up each 5-year period. For example, the 5-year return for the Equity Fund to June 30th 2012 includes results from 2008 through 2012. The return for 2013 has four of the same years (2009-2012).
So while rolling 5’s are a good measure of the consistency of a manager and what the client experience has been like, it has its weaknesses. Obviously, one strong or weak year can influence multiple periods (five). It can also be argued that five years are not long enough. Ideally you’d like to assess your manager over a full market cycle, and cycles can play out over longer periods.
Assessing performance
At the end of each year, when you’re doing your performance assessment, you want to use a combination of measures to see how you’ve done.
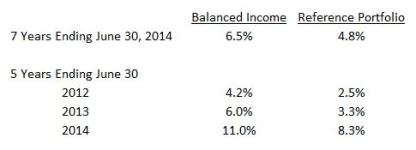
Below I’ve summarized how Steadyhand clients have done. For this purpose, we’ve consistently used the Balanced Income portfolio (50% fixed income / 50% stocks) because it includes everything we do and applies to a large number of our clients.
Annualized Returns After Fees
*Notes:
- 50% fixed income and 50% stocks.
- Made up of 4 Steadyhand funds – Income (66%), Equity (14%), Global Equity (13%) and Small-Cap Equity (7%).
- Re-balanced at each quarter-end.
- Returns are after all fees, before any rebates.
- Compared to a reference portfolio to give the investor a sense of the market environment.
- The reference portfolio is made up of appropriate market indexes (50% DEX Universe Bond Index; 30% S&P/TSX Composite Index; 20% MSCI World Index). It assumes an overall management and administration cost of 0.5% per year (calculated quarterly).
Management fees and expenses all may be associated with mutual fund investments. Please read the prospectus before investing. Mutual funds are not guaranteed, their values change frequently and past performance may not be repeated. The indicated rates of return are the historical annual total returns including changes in unit value and reinvestment of all distributions and do not take into account sales, redemption, distribution or optional charges or income taxes payable by any securityholder that would have reduced returns.
1We're not a bank.
Which means we don't have to communicate like one (phew!). Sign up for our blog to get the straight goods on investing.

Steadyhand helps Canadians grow their wealth with a simpler, more human experience. Learn more.