By Scott Ronalds
A theme in our blog postings this month is to bring readers inside the tent. Many clients express an interest in how we run our business, so we’re bringing it to life.
In the second article of our five-part series (Five Sources of Tension), we noted that our website is one of our greatest sources of constant tension, as we aim to keep it fresh and engaging, yet clean and simple. In this follow-up posting, we look at one of the tools we use to monitor engagement and interest in our site, Google Analytics.
The program enables us to track our website with precision – it shows where visitors are coming from, which pages they viewed, how long they stayed on the site, which web browser they used (Internet Explorer, Safari, Firefox, etc.), which type of mobile device they used, what they ate for lunch, etc. We can see when a particular blog or article hits a nerve, which reports are being read (or not read), and when traffic to the client portal spikes. The analytics can get pretty granular. In fact, it’s a little creepy.
One of the cool features is the geographic tracking. It shows the countries, regions and cities that generate the most web traffic. While we generate the bulk of our traffic in the domestic market, we get visits from around the world (although we only offer our funds in five provinces). Yesterday, for instance, we had visitors from Australia, the Dominican Republic, France, Mauritius, Mexico and Malaysia, among other countries. Perhaps we’re raising some eyebrows abroad, or maybe our clients are just exotic travelers.
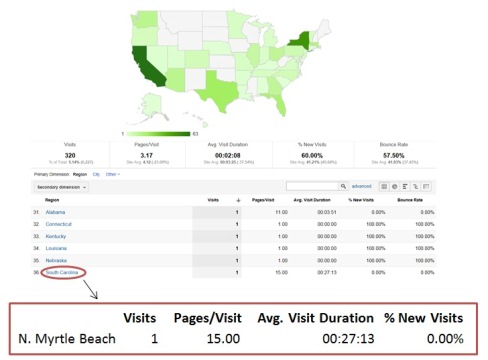
I was looking at our U.S. traffic yesterday for the month of April and noticed a particularly engaged visitor from South Carolina. They were on the site for nearly 30 minutes and visited 15 pages. Further digging showed they were a returning visitor, and were viewing our site from North Myrtle Beach. They were left-handed and had a dog named Trixy (OK, we can’t confirm this, but Google will probably be able to shortly).
While some of the Google features are more incredible/entertaining than practical, the Analytics help us determine what’s working on the site and what needs improvement. The geographic tracking can also be a signal that we should visit a certain city or region if the interest is there. Step it up, Hawaii.

Steadyhand helps Canadians grow their wealth with a simpler, more human experience. Learn more.
Stay in the Know
Stay current on Steadyhand news and views through our monthly newsletter.
Subscribe